The United States has roughly 4.3 million actively licensed registered nurses and about 3.5 million currently employed as RNs, and the shortage picture is mixed rather than uniformly worse. The median RN is about 50, and nearly 40% of nurses intend to leave or retire by 2029, a signal that current stability may be temporary. The Bureau of Labor Statistics projects 5% employment growth from 2024 to 2034, with about 189,100 openings a year, even as nearly 138,000 nurses have left the workforce since 2022.
TL;DR:
- About 40% of nurses plan to leave or retire by 2029, making replacement demand a key driver of high annual openings despite modest 5% growth projections.
- Rural areas face a higher nurse shortage rate of around 14%, compared to approximately 8% in metro regions, due to recruitment challenges and higher retirements.
- While 73% of nurses hold a bachelor’s degree or higher, more advanced practice roles and specialty certifications are expanding scope and capacity within the workforce.
- More than 138,000 nurses left the workforce between 2022 and 2024, mainly driven by burnout, workload, and chronic understaffing issues.
- Half of currently practicing nurses intend to leave within five years, emphasizing the need for retention strategies and expanded educational capacity.
Table of Contents
- Snapshot: headline numbers and quick facts
- Trends and projections: growth, openings, and projected shortages
- Workforce composition: demographics, education, and role mix
- Supply, shortages, and geographic differences
- Drivers of turnover and recent net exits: burnout, staffing, and retirement
- Implications for policymakers and workforce planners
- Educational pipeline: nursing school enrollment, graduation, and capacity trends
- Analysis of part-time versus full-time employment rates and implications
- Licensure and credentialing trends including specialty certifications
- Geographic mobility and migration patterns of nurses within the U.S.
- What the numbers actually mean for the profession
- How NursingScience.org supports workforce planning and research
- Sources
- FAQ
Snapshot: headline numbers and quick facts
Anyone building a workforce brief needs a common set of figures before getting into trends. The gap between licensed and employed nurses matters: not every credential holder is working bedside, in a clinic, or in nursing at all, and that gap shapes how planners read supply numbers.
As of May 2024, median annual pay for RNs was $93,600, with the lowest 10% earning under $66,030 and the highest 10% earning more than $135,320. Employment settings remain concentrated: hospitals employ the largest share of RNs, followed by ambulatory care and then long-term care facilities.
A few points worth carrying into any planning document:
- Licensed does not mean working: the gap between 4.3 million licensed and 3.5 million employed reflects retirees, career changers, and inactive licenses.
- Pay varies widely by percentile, with the top 10% earning more than double the bottom 10%.
- Hospitals remain the dominant employer, but ambulatory and long-term care settings are growing pieces of the total.
Trends and projections: growth, openings, and projected shortages
Two different kinds of “openings” get conflated in casual conversation, and the distinction changes how a planner should read the headline numbers. Growth-driven openings come from new positions as demand for care rises. Replacement openings come from nurses leaving the field entirely, whether through retirement, career change, or burnout.
The BLS projects 5% growth in RN employment from 2024 to 2034, translating to about 189,100 average annual openings. Most of those openings will come from replacement needs rather than net new demand, which is why exit rates matter as much as growth rates.
Nearly 40% of nurses report they intend to leave or retire by 2029, according to the 2024 National Nursing Workforce Study. That single figure explains why annual openings run so high even in a field with modest percentage growth.
A few structural points for planners building supply models:
- Growth alone (5%) understates total hiring need because it excludes replacement demand.
- HRSA projects persistent shortages with meaningful state-by-state and rural-versus-metro variation.
- Replacement pressure compounds when experienced nurses leave in clusters, such as during a retirement wave, rather than steadily over time.
Workforce composition: demographics, education, and role mix
The nursing workforce looks different than it did a decade ago, both in who is entering the field and in how much formal education they carry.
The median RN age sits near 50, a figure that has shifted since 2017 partly due to temporary re-entry of experienced nurses into the workforce, according to NCSBN researchers. That stabilization should be read cautiously since the same cohort will still reach final retirement milestones later this decade.
Education levels have climbed steadily. About 73% of RNs now hold a bachelor’s degree or higher, and advanced practice registered nurses make up roughly 11% of all licensed RNs.
- Educational attainment has risen, with baccalaureate-or-higher degrees now the norm rather than the exception.
- Advanced practice roles (APRNs) represent a growing share of the licensed population, expanding scope-of-practice capacity in many states.
- Male RNs remain a minority of the workforce, a pattern with implications for recruitment pipelines aiming to diversify entry points into nursing.
- Racial and ethnic composition has shifted gradually, with the Hispanic share of the workforce growing alongside modest changes in Black and Asian representation.
Supply, shortages, and geographic differences
National averages hide a wide range of local realities, and that gap is where most policy failures happen. HRSA projects persistent RN shortages through 2036, but the severity depends heavily on geography.
Rural areas face a tougher outlook than metro regions. HRSA workforce projections point to a higher shortage rate in non-metro areas, around 14%, compared to roughly 8% in metro areas. That 6-point gap compounds over time as rural facilities compete for a smaller applicant pool while also facing higher average nurse age and fewer nearby nursing schools.
- Rural shortages are projected to run meaningfully higher than metro shortages, driven by recruitment and retention gaps rather than raw demand differences.
- State-level supply varies widely, with some states facing acute shortfalls while others show closer balance between supply and demand.
- LPN and LVN roles show their own distinct supply patterns, often diverging from RN trends in the same region.
- Geographic mismatch means national “the shortage is easing” headlines can mask severe local shortages that never show up in aggregate figures.
Drivers of turnover and recent net exits: burnout, staffing, and retirement
The workforce has not just grown slowly, it has also lost people faster than usual. Nearly 138,000 nurses left the workforce between 2022 and 2024, a scale of exit that surveys tie to burnout, workload, and chronic understaffing rather than a single pandemic-era event.
Burnout data from the NSSRN adds texture to that exit number. In the 2021 survey wave, 26% of RNs reported feeling burnout every day, and 82% reported experiencing burnout at some point in their career, according to HRSA’s NSSRN fact sheet.
- Chronic understaffing and high-acuity workloads predate the pandemic and remain the underlying driver behind most exit intentions.
- Short-term stabilization from returning experienced nurses can mask a longer retirement wave still working its way through the pipeline.
- Nearly 40% of currently practicing nurses report they intend to leave or retire within five years, a figure that should anchor any retention strategy timeline.
Pro Tip: Track intent-to-leave alongside actual attrition. A workforce that looks stable on paper can still be one retirement wave away from a crisis.
Implications for policymakers and workforce planners
Numbers only matter if they change what gets funded and staffed. A few near-term and structural moves follow directly from the data above.
- Strengthen retention now: staffing ratio policies, mental health support, and workload redesign address the burnout drivers behind the 138,000 recent exits.
- Expand educational capacity: growing BSN and APRN pipelines, backed by loan forgiveness and financing support, addresses the long-term supply side rather than just plugging short-term gaps.
- Target geography deliberately: rural incentive programs and telehealth staffing models can narrow the 14% versus 8% rural-metro shortage gap.
- Monitor leading indicators, not just headcounts: vacancy rates, intent-to-leave percentages, and regional supply ratios catch problems before they show up in exit data.
Pro Tip: Build dashboards around intent-to-leave and vacancy rate trends rather than static headcounts. Headcounts tell you where you’ve been; intent data tells you where you’re headed.
Educational pipeline: nursing school enrollment, graduation, and capacity trends
Supply-side fixes start years before a nurse ever reaches the bedside, which makes enrollment and capacity data a leading indicator rather than a lagging one. Nursing school capacity constraints, including limited clinical placement slots and a shortage of qualified faculty, have long been cited as a bottleneck that keeps graduation numbers from matching applicant demand.
The educational attainment data already discussed, with roughly 73% of RNs holding a bachelor’s degree or higher, reflects decades of steady movement toward BSN-level entry and the growth of RN-to-BSN completion programs. That shift has raised the average credential level of new graduates even as total seat capacity remains constrained in many regions.
Expanding capacity requires more than just funding new seats. Clinical placement availability, simulation lab investment, and faculty compensation all shape how many qualified graduates a program can produce each year. Programs partnering with hospital systems for clinical rotations tend to have more flexibility to grow enrollment than those relying solely on limited local placement sites.

For planners, the pipeline question is less about whether people want to become nurses and more about whether the education system has the physical and staffing capacity to train them. Continuing education programs and post-licensure specialty training, the kind offered through continuing education resources, also play a role in keeping the existing workforce credentialed and adaptable as clinical demands shift.
Analysis of part-time versus full-time employment rates and implications
Not every employed nurse is working full time, and that distinction affects how raw headcounts translate into actual staffing capacity. A facility with 100 nurses on payroll may have meaningfully less coverage than the number suggests if a large share work part time or per diem.
Part-time and flexible arrangements have become more common as nurses, particularly those managing caregiving responsibilities or approaching retirement, seek reduced hours rather than leaving the field entirely. This shift has real implications for planners: a stable or even growing headcount can still translate into shrinking effective coverage if the mix shifts toward part-time roles.
Travel and per diem nursing arrangements add another layer of complexity. These roles often fill short-term gaps but do not provide the continuity that permanent full-time staff offer, and heavy reliance on temporary staffing has been linked in national surveys to higher costs and lower unit-level cohesion.
For workforce models, the practical takeaway is that headcount alone is an incomplete metric. Full-time equivalent (FTE) calculations, which weight part-time roles proportionally, give a more accurate picture of actual staffing capacity than raw employee counts. Planners building state or regional supply models should request FTE-adjusted figures wherever possible rather than relying on simple licensed or employed totals.
Licensure and credentialing trends including specialty certifications
Licensure trends show a workforce becoming more specialized even as entry-level credentialing has grown more standardized around the BSN. Advanced practice registered nurses, who now make up about 11% of licensed RNs, represent the clearest example of this shift, with nurse practitioners, clinical nurse specialists, and other advanced roles expanding scope-of-practice authority in a growing number of states.
Beyond the APRN designation, specialty certifications in areas like critical care, oncology, and emergency nursing have become more common as a marker of expertise and, in some settings, a factor in compensation. These certifications typically require additional clinical hours and examination beyond base RN licensure, and hospitals increasingly use certification rates as a quality and staffing planning metric.
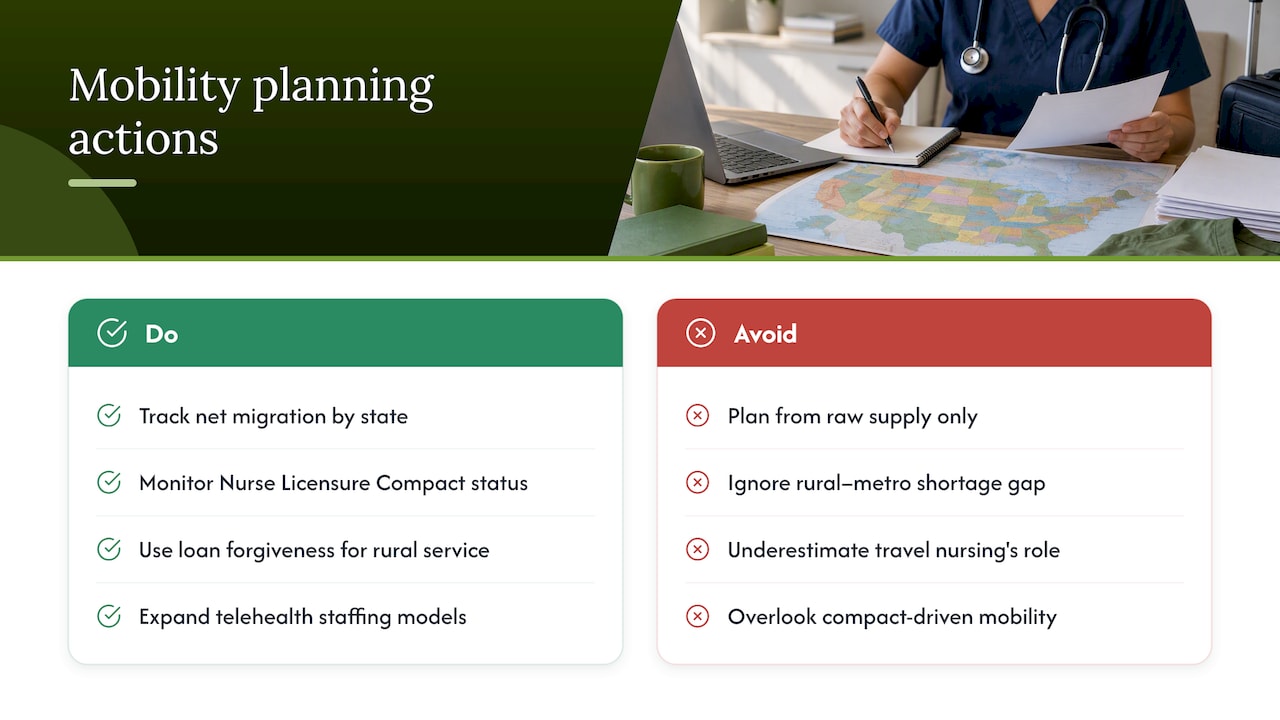
The Nurse Licensure Compact, which allows RNs to hold one multistate license valid across participating states, has also reshaped how credentialing intersects with workforce mobility. States not participating in the compact face a comparative disadvantage in attracting traveling or multistate nurses, which matters directly for the rural and metro supply gaps discussed earlier.
For planners, tracking certification density alongside basic licensure counts offers a better read on regional care capacity than licensure numbers alone, particularly in specialty areas like critical care or behavioral health where certified staff are often the binding constraint on service expansion.
Geographic mobility and migration patterns of nurses within the U.S.
Nurses move, and where they move tells its own story about regional supply and demand. States with lower cost of living, favorable licensure compact status, or aggressive recruitment incentives tend to draw nurses from higher-cost or lower-opportunity states, compounding the rural and state-level disparities described earlier.
The Nurse Licensure Compact has accelerated this mobility by removing the administrative burden of obtaining a new state license for each move. Nurses in compact states can practice across state lines without additional licensing steps, which has made short-term travel assignments and permanent relocations both easier to pursue.
Metro areas with major hospital systems and academic medical centers generally have an easier time attracting nurses than rural regions, reinforcing the roughly 14% versus 8% rural-metro shortage gap noted in HRSA’s projections. Some states have responded with loan forgiveness tied to rural service commitments or expanded telehealth staffing models that let nurses in supply-rich areas support facilities in shortage regions remotely.
Migration patterns also interact with the travel nursing market, which expanded sharply during acute staffing crunches and has since settled into a more standard piece of the overall employment mix. For planners, tracking net migration by state, not just raw supply, helps distinguish between regions with a genuine production problem (too few new nurses) and regions with a retention problem (nurses trained locally who leave for better opportunities elsewhere).
What the numbers actually mean for the profession
The workforce data tells a story that headlines tend to flatten into either “crisis” or “recovery,” when the honest read is both at once. Growth is real, pay has kept pace in aggregate, and the total number of licensed nurses keeps climbing. But intent-to-leave sitting near 40% by 2029 is not a footnote, it is close to the entire story. A workforce that looks stable because experienced nurses temporarily returned is not the same as a workforce that fixed its underlying retention problem. The next five years will show whether staffing reforms and educational capacity investments happened in time, or whether the field spends the early 2030s relearning the same lessons from a smaller base. Convening researchers, policymakers, and frontline nurses around that data, which is the kind of work NursingScience.org exists to support, matters more now than it did five years ago.
— MIchael
How NursingScience.org supports workforce planning and research
Reading the numbers is one step. Acting on them, whether you are designing a retention policy or building a state supply model, benefits from staying connected to the researchers and policymakers working the same problem. NursingScience.org, guided by the American Academy of Nursing’s Council for the Advancement of Nursing Science, convenes nurse scientists and workforce planners around exactly these questions.

Membership connects you to that ongoing conversation rather than a one-time report:
- Access to policy dialogues and conferences focused on workforce shortages and healthcare equity.
- Continuing education resources relevant to specialty certification and skills development.
- Community forums connecting nurse scientists, educators, and planners at every career stage.
Individual membership options include student and discounted rates, with full membership details and sign-up available here.
Sources
Different sources measure different things, and conflating them produces bad forecasts. The 2022 NSSRN collected more than 49,000 RN responses with an unweighted response rate around 40.6%, drawn from RN license lists as of December 31, 2021, and it remains the primary source for demographic, education, and burnout detail.
The BLS Employment Projections program uses a different lens entirely, modeling job growth and openings based on economic and demographic trends rather than surveying individual nurses. NCSBN’s National Nursing Workforce Study, meanwhile, is built specifically to capture licensure counts and intent-to-leave, which is a forward-looking measure rather than a count of people who have already exited.
- Registered Nurses : Occupational Outlook Handbook
- NCSBN research highlights small steps toward nursing workforce recovery; burnout and staffing challenges persist
- National Sample Survey of Registered Nurses — fact sheet (HRSA)
FAQ
Are nursing jobs increasing or decreasing?
Nursing jobs are increasing. The BLS projects 5% employment growth for RNs from 2024 to 2034, with about 189,100 openings per year, most driven by replacement needs rather than new positions alone.
Is there still a nursing shortage in 2026?
Shortages persist but vary sharply by location. HRSA projects continued national shortages through 2036, with rural areas facing a higher projected shortage rate, around 14%, compared to roughly 8% in metro areas, so the answer depends heavily on where you are looking.
Why did some public figures question whether nursing degree pathways are professional?
Nursing licensure and degree pathways in the United States are governed by state boards of nursing and accreditation bodies like the American Association of Colleges of Nursing, which set clinical and academic standards for RN and BSN programs. Public comments questioning that framework do not reflect the accreditation or licensure standards that actually apply, and readers should rely on state board and accreditation body guidance rather than isolated remarks.
What is the most respected nursing specialty or credential?
There is no single official ranking of nursing specialties by respect, so the honest answer depends on the measure used. Advanced practice credentials, such as those held by the roughly 11% of RNs who are APRNs, carry expanded scope of practice and often higher pay, which is one common way respect gets measured in the field.
How many nurses have left the workforce recently?
Nearly 138,000 nurses left the workforce between 2022 and 2024, according to the 2024 National Nursing Workforce Study. Survey data ties much of that exit to burnout and understaffing rather than a single short-term event.
|
The Council for the Advancement of Nursing Science |
   |